A Handy Guide to Resource Limits or What is LVE?
All hosting accounts on Naija Domains shared, business and reseller platforms have resource limits in place. These resource limits are designed to safeguard your account. In the past, other users on the server could consume all of the available resources (CPU/Processor, RAM/Memory or Disk Access) and cause a slow down for other websites hosted on the same server.
Naija Domains use the CloudLinux operating system that has resource limits set by a LVE system; kernel-level technology embedded in the server to ensure all websites on the server get full access to a fair share of resources.
Naija Domains resource limits are generous. Typically, our limits are much higher than that of other hosting companies giving every website a lot more space to grow. We can offer higher limits for two main reasons:
1. We use faster, more powerful servers. A typical server uses the latest Intel Xeon E5 processors, up to 128GB of DDR3 RAM and fast hard disks with SSD technology.
2. We place fewer accounts per server than that of our competitors. ‘Overcrowding’ of servers is a common technique used by competitors to try and squeeze more money from customers. Naija Domains load our servers with fewer accounts to deliver a better quality of service.
Our current resource limit ceiling is set as follows:
Value, Professional, Reseller packages.
- Number of concurrent web-server requests: 20
- Amount of RAM all client’s processes can use: 1Gb (with the allowed burst up to 4Gb)
- Percentage of CPU time: 20% (with the allowed burst up to 100%)
Ultimate package.
- Number of concurrent web-server requests: 30
- Amount of RAM all client’s processes can use: 2Gb (with the allowed burst up to 6Gb)
- Percentage of CPU time: 40% (with the allowed burst up to 200%)
Business SSD package
- Number of concurrent web-server requests: 40
- Amount of RAM all client’s processes can use: 2Gb (with the allowed burst up to 8Gb)
- Percentage of CPU time: 60% (with the allowed burst up to 400%)
NOTE: The burst allowance is used to stabilize the operation of the website during peak intervals. If your account/server employs the higher burstable resources on a consistent basis, an upgrade to a package with higher resource availability should be considered.
As you can see, more expensive packages come with more resources and are designed for busier websites.You can upgrade your hosting account at any time to a higher resource package if you run into any of the limits we have in place. Just contact our team who will be happy to assist.
Checking your current usage
It is possible to check your current resource usage via cPanel account. Log into your hosting panel and navigate to Stats widget on the left:

CPU Usage specifies how much of the allocated CPU resources you are currently using. The amount of CPU resources we provide to each account is the percentage of the server’s resources. If CPU reaches 100% it means that your account is using all of the CPU resources allocated, and any new processes will be put to sleep until existing processes complete. This can cause your website to slow down dramatically and in extreme cases even time out.
Virtual Memory Usage corresponds to the amount of memory, processes can allocate within LVE. When the process tries to allocate memory, CloudLinux checks if the new total virtual memory used by all processes in LVE is within the limit set. If it is not, CloudLinux will prevent memory from being allocated and in most cases this causes the process to fail.
Physical Memory Usage (RAM) is the actual memory allocated for your account. Virtual memory is usually a file on a disk drive that the operating system uses to store information (swap-to-from) when the real memory becomes full, for instance the page (swap) file on a Linux system. Therefore, if you try to publish a big post, it might take all physical memory to do so, but after some time it will be normalized.
If this value reaches the limit you may begin to experience PHP errors (if applicable) on your website, or in very extreme cases may see a CloudLinux error page. These errors are typically only brief and once the usage has reduced to below the limit, will automatically clear.
Entry Processes is the number of processes that enter your account. For example, every PHP page that is accessed by a user will usually generate a single entry process. Many people misinterpret this value as “number of visitors you can have on your website at once”. Whilst it is true that each visitor accessing a PHP page will spawn an entry process, these processes usually end so quickly that it is extremely unlikely that 10 will be spawned concurrently and at a single moment unless you had a significantly large number of simultaneous visitors on your website at once. SSH sessions and cron jobs also count as entry processes.
Number of Processes is this limit is similar to the above but includes all processes generated by the account rather than the specific PHP, SSH or cron jobs. This number is typically very low, even under high activity, as non-PHP tasks execute and complete even more quickly.
I/O Usage (input/output) represents how much I/O (or disk activity) your account is using. Any task which makes use of the servers disk drive (such as reading or writing to the server) will consume I/O. We limit the maximum disk speed of each account to ensure that no single account can saturate the disk drives which will reduce performance for everyone.Reaching this limit will cause all processes to slow down (to within this limit) and take much longer to complete. Typically you won’t notice this setting ever increase unless you perform something disk intensive like generating a large backup of your account.
It is possible to check resource usage of your account in more details through another menu:
for cPanel paper_lantern theme:
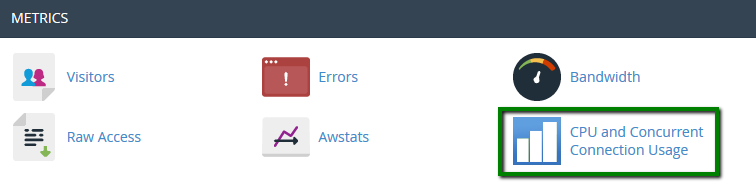
Navigate to Metrics section and click on CPU and Concurrent Connection Usage menu:
NOTE: If your resource usage limits are being frequently hit, you will see a corresponding warning message on the top of the page with the reference to the exact limits.
Choose the desired period in Timeframe drop-down and click SubmitQuery:
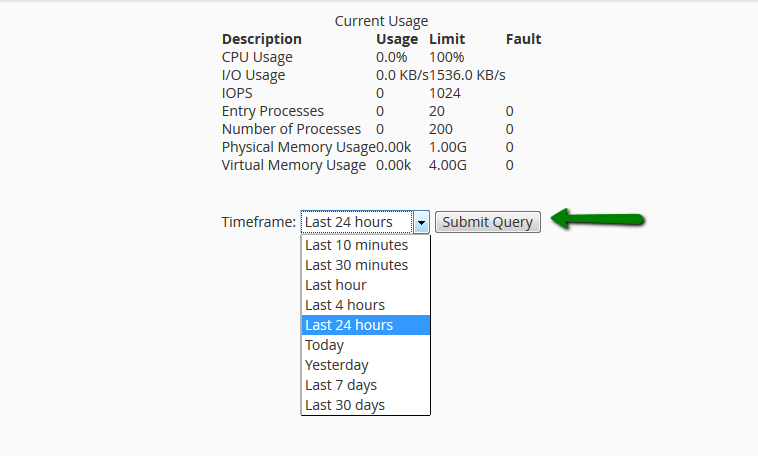
You will see diagrams and tables showing detailed statistics:


CPU – CPU limits
vMEM/vM – Virtual Memory limits
pMEM/pM – Physical Memory limits
EP – Entry Processes
nPROC/nP – Number of Processes
IO – Input/Output limits
a – average used
l – limit set for account
m – maximal used
f – failure